Naive Bayes Example
Sure, let's break down Naive Bayes with a simple example, covering both the mathematical concept and a basic Python implementation. Naive Bayes is a probabilistic classifier based on Bayes' theorem with the "naive" assumption of independence between features.
Mathematical Concept
Given a dataset with features ( X = { x_1, x_2, \ldots, x_n } ) and a target variable ( y ):
-
Bayes' Theorem:
- ( P(y | X) ): Posterior probability of class ( y ) given features ( X ).
- ( P(X | y) ): Likelihood of features ( X ) given class ( y ).
- ( P(y) ): Prior probability of class ( y ).
- ( P(X) ): Probability of features ( X ) (normalizing constant).
-
Naive Assumption:
Assuming independence between features ( x_i ).
Example Scenario
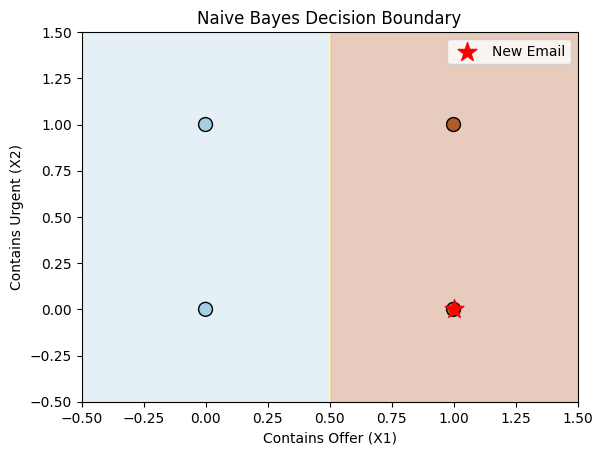
Let's consider a simple example where we want to classify whether an email is spam or not based on two features:
- ( X_1 ): Contains the word "offer".
- ( X_2 ): Contains the word "urgent".
Given training data, we calculate the probabilities ( P(X_1 | y) ), ( P(X_2 | y) ), ( P(y) ), and then use Bayes' theorem to predict whether new emails are spam or not.
Python Code Example
from sklearn.naive_bayes import GaussianNB
import numpy as np

# Example data: X = features, y = target
X = np.array([[1, 1], [1, 0], [0, 1], [0, 0]])  # Features: [contains offer, contains urgent]
y = np.array([1, 1, 0, 0])  # Target: [spam, spam, not spam, not spam]

# Initialize a Naive Bayes classifier
model = GaussianNB()

# Train the model
model.fit(X, y)

# Predictions for new data
new_data = np.array([[1, 0]])  # New email: contains offer but not urgent
predicted = model.predict(new_data)

# Output prediction
if predicted[0] == 1:
    print("Predicted: Spam")
else:
    print("Predicted: Not Spam")
In this example:
Xrepresents the features where each row corresponds to an email.yrepresents the target labels (spam or not spam).- We use
GaussianNBfrom scikit-learn for the implementation, assuming Gaussian distribution for numerical features.
You can also visualize Naive Bayes classification using a decision boundary plot. This is useful for understanding how the classifier separates different classes. Below, we'll write Python code that:
- Trains a Naive Bayes classifier on a simple 2D dataset.
- Plots the decision boundary to visualize classification regions.
Graphical Representation of Naive Bayes
We'll generate synthetic data, train a Naive Bayes model, and plot decision boundaries.
Python Code with Graph
import numpy as np
import matplotlib.pyplot as plt
from sklearn.naive_bayes import GaussianNB
from sklearn.datasets import make_classification

# Generate synthetic data
X, y = make_classification(n_samples=100, n_features=2, n_classes=2, n_clusters_per_class=1, random_state=42)

# Train Naive Bayes model
model = GaussianNB()
model.fit(X, y)

# Plot decision boundary
x_min, x_max = X[:, 0].min() - 1, X[:, 0].max() + 1
y_min, y_max = X[:, 1].min() - 1, X[:, 1].max() + 1
xx, yy = np.meshgrid(np.linspace(x_min, x_max, 100), np.linspace(y_min, y_max, 100))

# Predict for each point in meshgrid
Z = model.predict(np.c_[xx.ravel(), yy.ravel()])
Z = Z.reshape(xx.shape)

# Plot contour
plt.contourf(xx, yy, Z, alpha=0.3, cmap=plt.cm.Paired)

# Scatter plot of actual data points
plt.scatter(X[:, 0], X[:, 1], c=y, edgecolors='k', cmap=plt.cm.Paired)

# Labels and title
plt.xlabel('Feature 1')
plt.ylabel('Feature 2')
plt.title('Naive Bayes Decision Boundary')

plt.show()
Output:

Explanation of the Graph
- The background color represents the decision regions of the Naive Bayes classifier.
- The contour lines separate different classes.
- The scatter plot points are the actual data points, color-coded by class.